Purpose
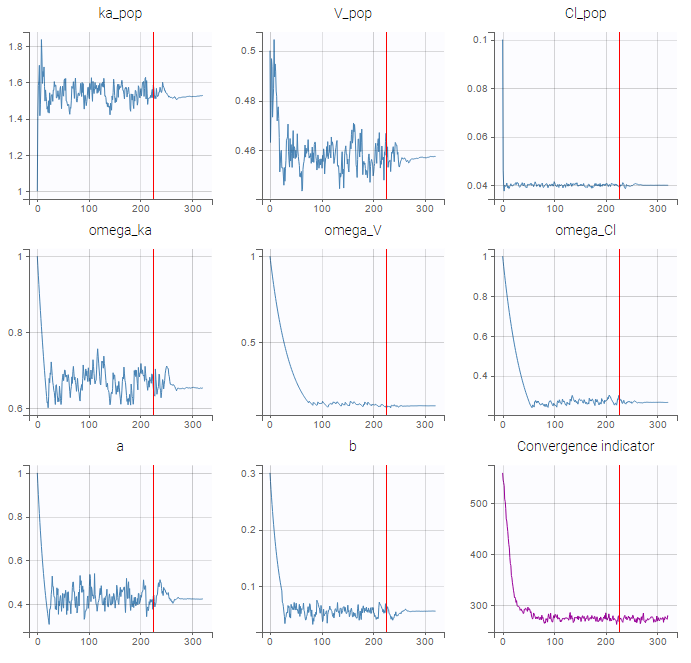
This plot displays the sequence of estimates for population parameters computed after each iteration of the SAEM algorithm. The purpose is to check the convergence of the algorithm. In addition, a convergence indicator gives the estimation for -2 x log-likelihood along the iterations.
Example
In the following example, the parameters of a one-compartment model with first-order absorption and linear elimination are estimated on the theophylline data set. The vertical line indicates where the algorithm switches from the first phase to the second. Notice also that the convergence indicator is displayed. More details on the convergence indicator can be found here.
Settings
- Select plots and arrange layout. It is convenient when there are many parameters and the user wants to focus on some particular parameter convergence for example.
By default, 12 parameters are displayed.