- Part 1: Introduction
- Part 2: Data exploration with Datxplore
- Part 3: Parallel first-order absorptions
- Part 4: Model of double absorption site
- Part 5: Simulations
Part 2: Data exploration with Datxplore
The data set has been originally published in:
100 mg doses of veralipride were given to 12 healthy volunteers by oral solution. Individual plasma concentrations of veralipride (ng/ml) were observed during 24h (time is measured in h) after the administration. Doses were given in the morning after an overnight fast, and subjects fasted up to 4 hr after drug administration in each case.
Below is an extract of the data set file:

The columns are:
- ID: the subject ID, column-type ID.
- TIME: the time of the measurement or of the dose, column-type TIME.
- AMT: the amount of drug provided to this subject, column-type AMOUNT
- Y: the measurement, column-type OBSERVATION.
The data set and datxplore project file can be in Datxplore demos.
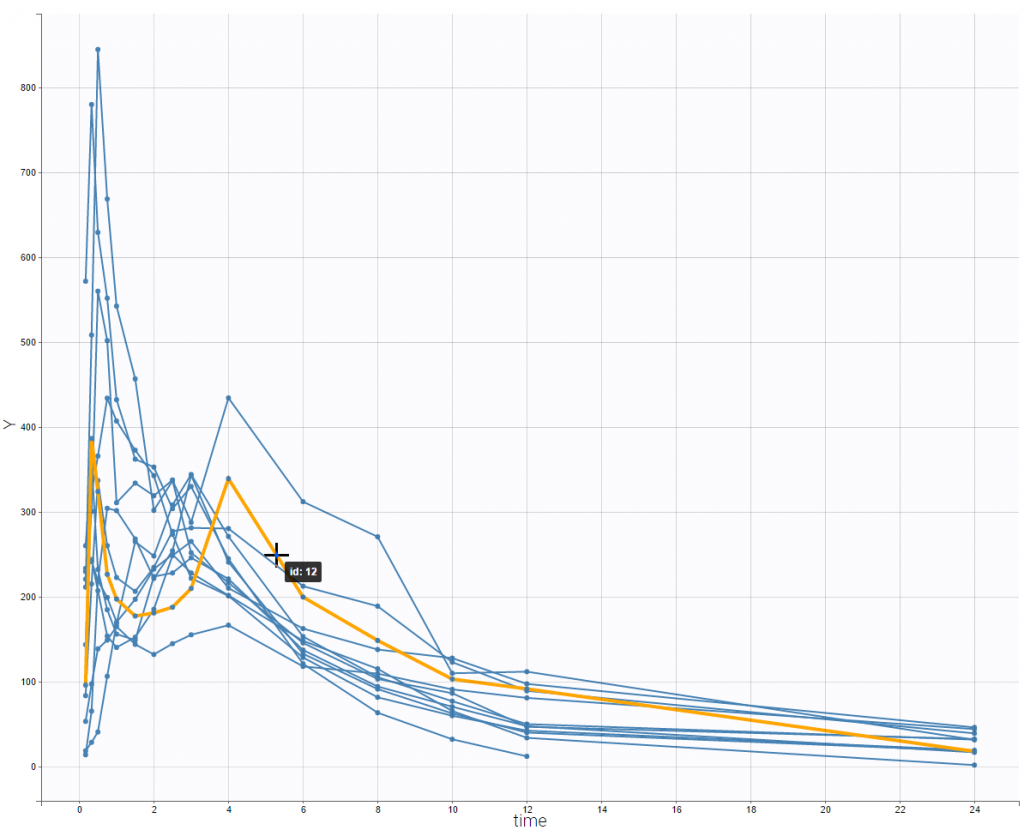
We first start with the exploration of the data set in Datxplore. After creating a new project in Datxplore, the dataset is loaded, with the default column-types. The plot of observations vs time is then generated. It is displayed on the figure below, with an highlighted example of individual exhibiting a double peak in plasma concentrations.

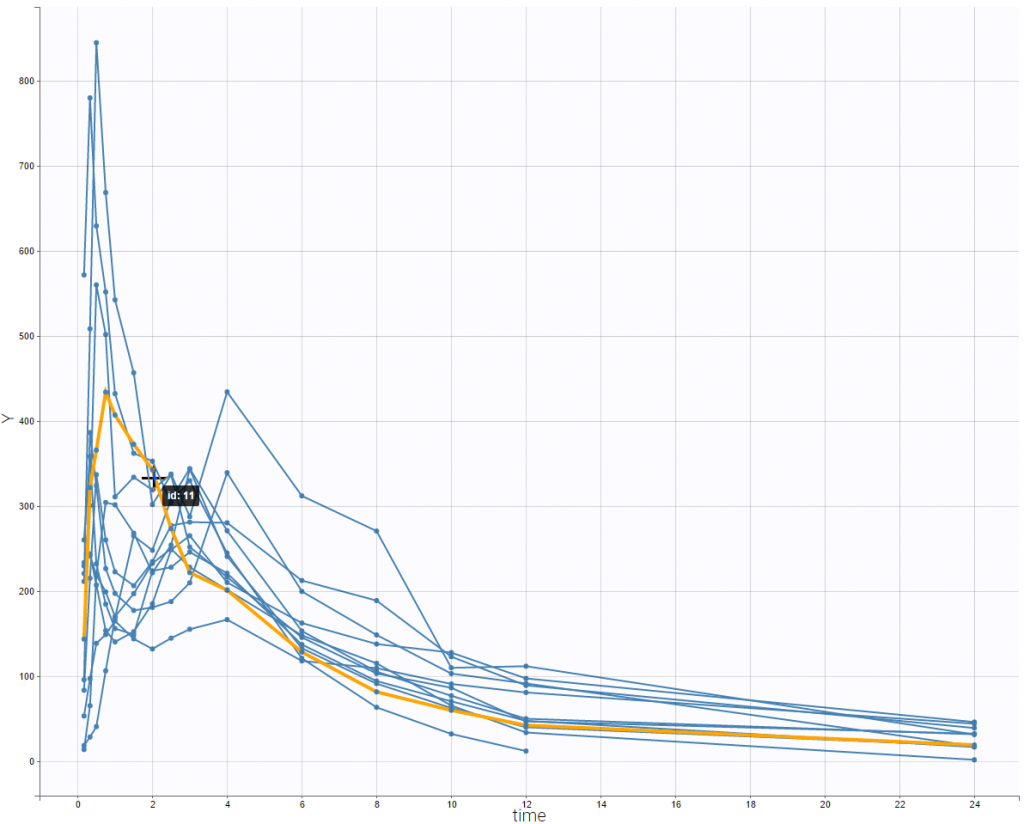
This double peak phenomenon is not systematically noticeable, as can be seen on the next figure.

Focusing on each individual with the individual selection in the Stratify panel allows to check that the second peak is not always measured as smaller than the first peak.
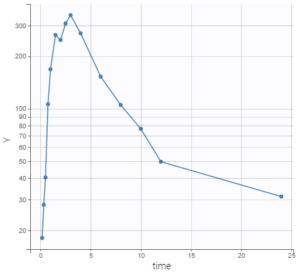
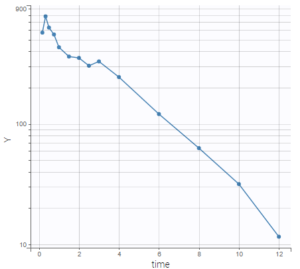
Choosing a log-scale on the Y axis is useful to focus on the elimination phase for each individual. Some of the individual curves seem to display an elimination phase with two slopes, characteristics of a two-compartments model. This is for example the case for the individual 8 as seen below (left), but not for individual 1 (below, right) which seems close to a linear elimination.
 |
 |
To conclude, this graphical exploration allowed to identify several properties:
- 9 out of 12 individuals exhibit a double peak in plasma concentrations.
- The second peak is not always smaller than the first.
- Some of the individual curves seem to display an elimination phase with two slopes, characteristics of a two-compartments model.