Starting from the 2019 version, it is possible to change the mapping between the data set observations ids and the structural model output. By default and in previous versions, the mapping is done by order, i.e. the first output listed in the output= statement of the model is mapped to the first OBSERVATION ID (ordered alphabetically). It is possible with the interface to set exactly which model output is mapped to which data output. Model output or data outputs can be left unused.
Changing the mapping
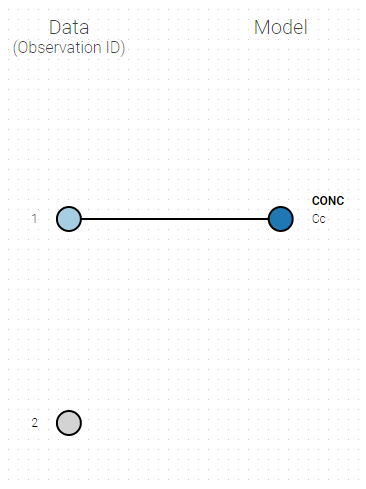
If you have more output in the data set (i.e more OBSERVATION IDs) than in the structural model, you can set which data output you will use in the project. In the example below there are two outputs in the data set (managed by the OBSERVATION ID column) and only one output in the structural model, Cc. By default the following mapping is proposed: the data with observation id ‘1’ is mapped to the modle prediction ‘Cc’. The model observation (with error model) is called ‘CONC’ (the name of the OBSERVATION column, can be edited):
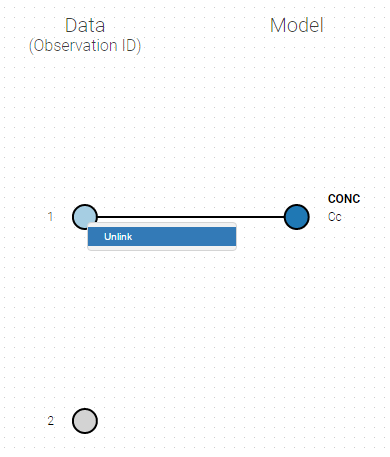
To set the data output to use to observation id ‘2’, you can either:
- Unlink by clicking on either the dot representing the output ‘1’ of the Data or ‘Cc’ of the structural model, and then draw the line between ‘2’ and ‘Cc’ (as can be seen on the figure below on the left)
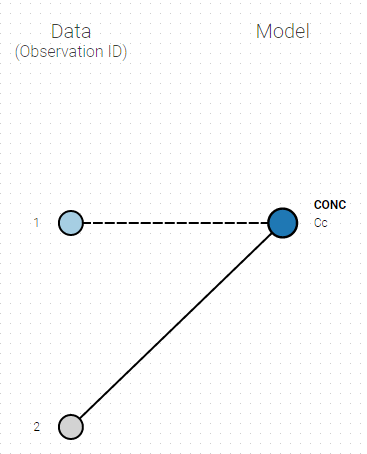
- Directly draw a line from ‘2’ to ‘Cc’ (as can be seen on the figure below on the right). This will automatically undo the link between ‘1’ and ‘Cc’.
 |
 |
|---|
And click on the button ACCEPT on the bottom on the window to apply the changes.
The same possibility is proposed if you have more outputs in the structural model, compared to the number of observation ids. If you have a TMDD model with both the free and the total ligand concentration listed as model output and one type of measurement, you can map either the free or the total ligand as can be seen on the following figure with the same actions as described above.
Several types of outputs
The mapping is only possible between outputs of same nature (continuous / count-categorical / event), i.e. it is only possible to map a continuous output with a continuous output of the structural model. Thus, mapping a continuous output with a discrete or a time-to-event is not possible. If you try to link a forbidden combination, the line connecting line will be displayed in red as in the following figure
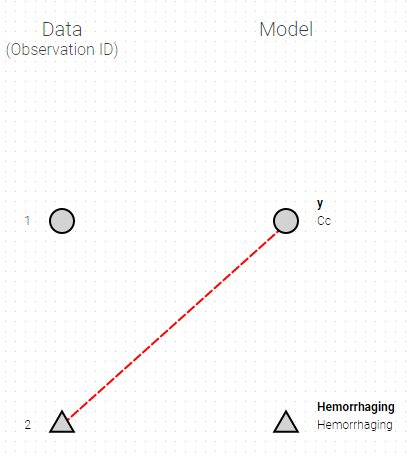
The type of output is indicated via the shapes:
- continuous outputs are displayed as circles
- categorical/count outputs are displayed as squares
- event outputs are displayed as triangles
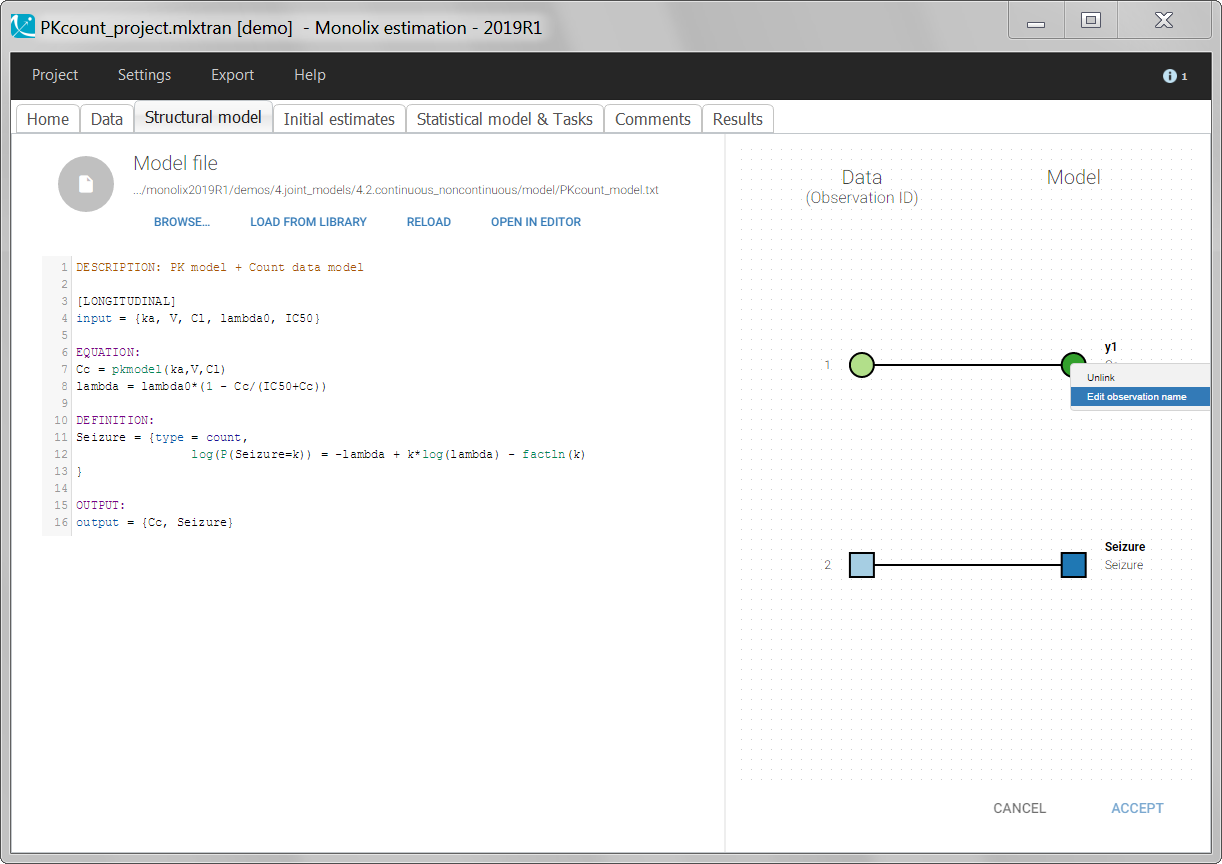
Changing the observation name
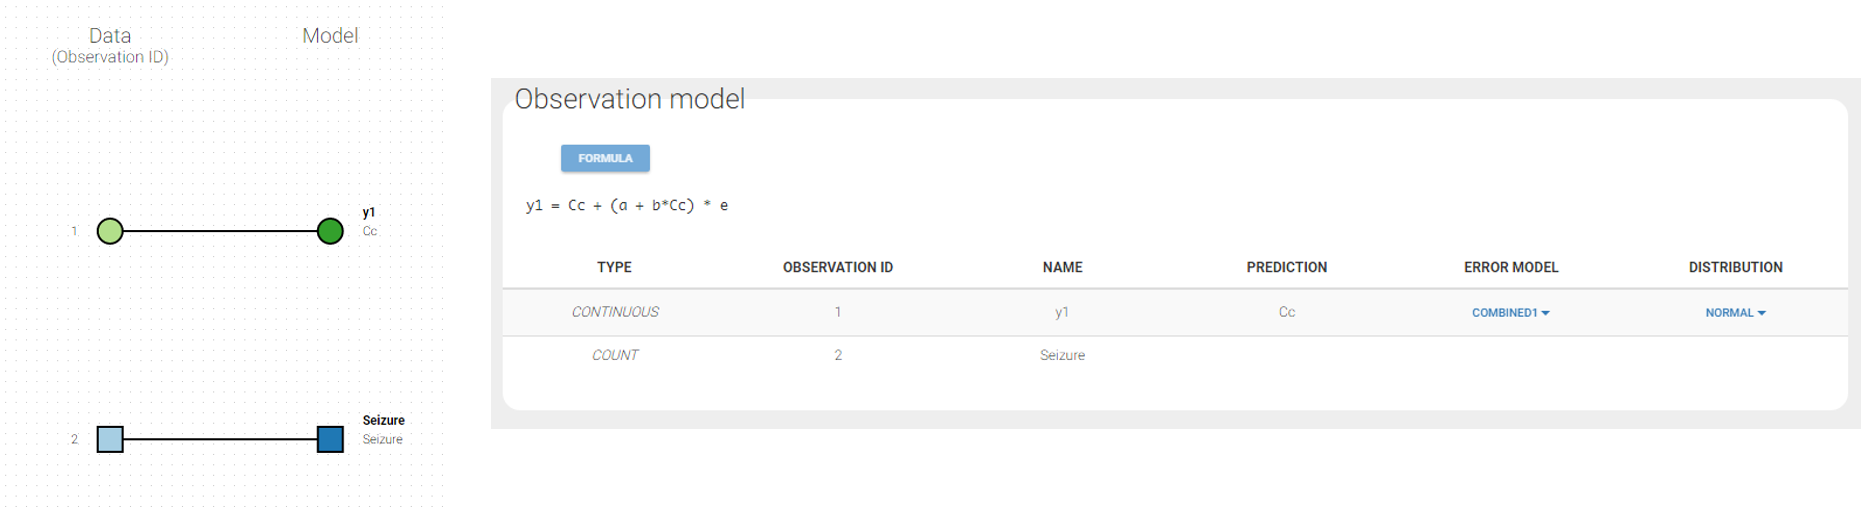
In the example below, ‘1’ is the observation id used in the data set to identify the data to use, ‘Cc’ is the model output (a prediction, without residual error) and ‘y1’ the observation (with error). ‘y1’ represents the data with observation id ‘1’ and it appears in the labels/legends of the plots. These elements are related by observation model, which formula can be displayed.
For count/categorical and event model outputs, the model observation is defined in the model file directly. The name used in the model file is reused in the mapping interface and cannot be changed.
For continuous outputs, the model file defines the name of the prediction (e.g ‘Cc’), while the model observation (e.g ‘y1’, with error) definition is done in the “Statistical model and tasks” tab of the interface. If there is only one model output, the default observation name is the header of the data set column tagged as OBSERVATION. In case of several model outputs, the observation names are y1, y2, y3, etc. The observation names for continuous outputs can be changed by clicking on the node and “edit observation name”: