Note: the features described on this page are not available in MonolixSuite versions prior to 2024R1.
MonolixSuite offers the ability to transfer plot formatting from one plot to another within the same project or across projects. This can save you time and effort when you want to apply the same formatting options, such as stratification, preferences, or settings, to multiple plots, or when you want to use the same plot formatting for different analyses or datasets.
- Transferring plot formatting within one project
- Transferring plot formatting across projects with plot presets
- Applying pre-defined plot formatting
- Restoring default plot formatting
Transferring plot formatting within one project
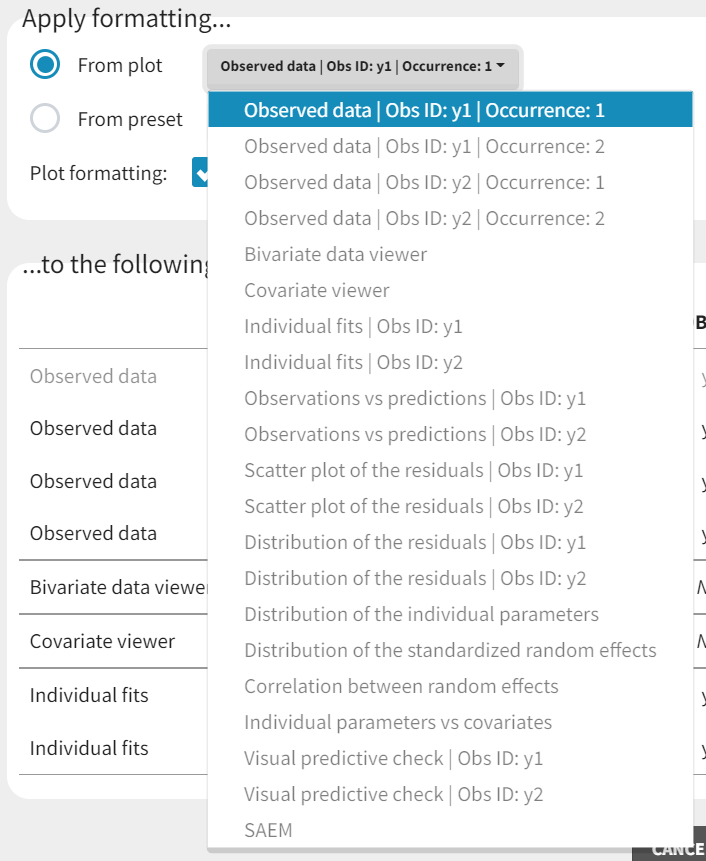
To transfer plot formatting within one project, you need to use the “Apply…” button on the bottom left of the Plots tab and select “From plot” in the window that opens:


Selecting the source and target plots
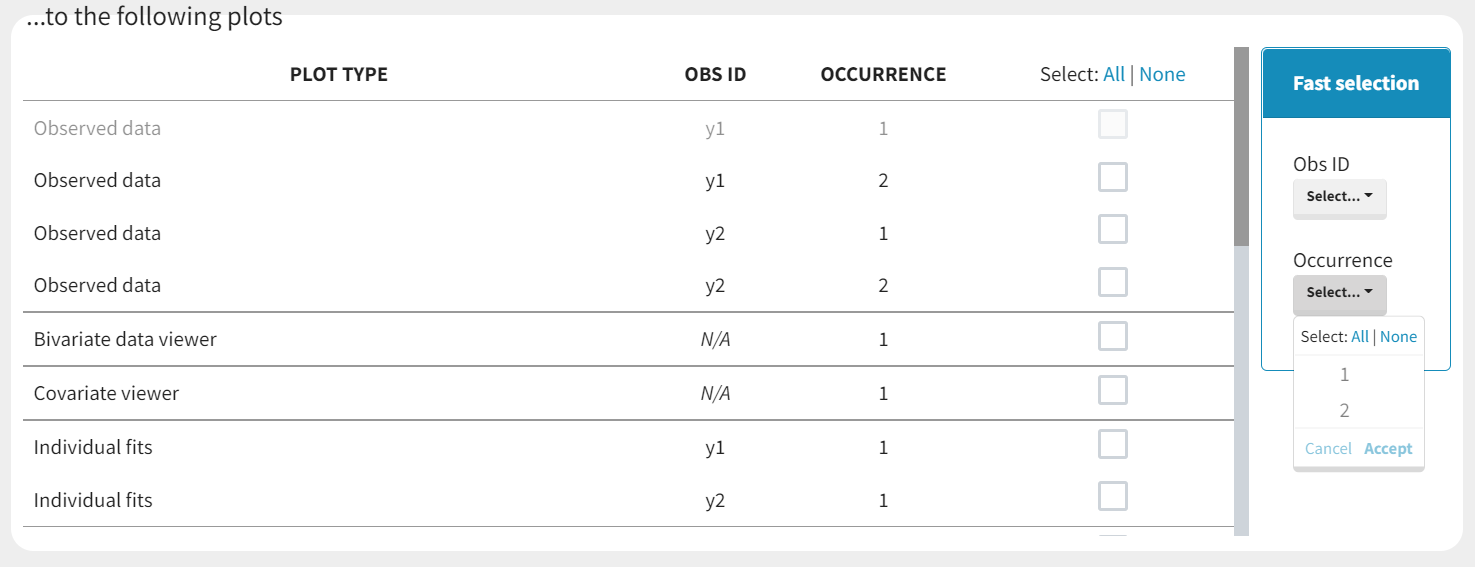
The window allows you to select the source plot, which is the plot that has the formatting you want to transfer, and the target plots, which are the plots that you want to apply the formatting to. You can select all plots by clicking on the Select all button, or select all plots specific to some observation id with the “Fast selection”, or corresponding to an occurrence rank if some plots have been generated with several occurences.
Choosing the sections to transfer
You can also choose which sections of the configuration you want to transfer: Stratify, Settings, or Preferences.
![]()
By default, Stratify and Preferences are selected.
- The Stratify section includes the options to stratify the plots by covariates or occasions.
- The Settings section includes the options to customize the content of the plots: elements displayed or not on the plots, such as the legend, the grid, the observed data points, etc, and calculation settings such as the axes, bins etc.
- The Preferences section includes the options to change the colors, fonts, sizes, etc.
Once you have selected the source plot, the target plots, and the sections to transfer, you can click on the Apply button to transfer the plot configurations.
Transferring plot formatting across projects with plot presets
To transfer plot formatting across different projects, you need to use the plot presets feature, which allows you to define and apply presets for plot configurations.
Defining a plot preset
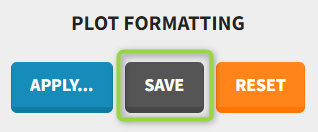
To define a plot preset, you need to first set up your plot configuration as you would like by choosing the stratification, preferences, and settings options for each plot (you can use the transfer or plot formatting between plots within the same project, described in the first section, to help you). Then, you can save this configuration as a preset by clicking on the Save icon in the Apply from the Plot Formatting panel:
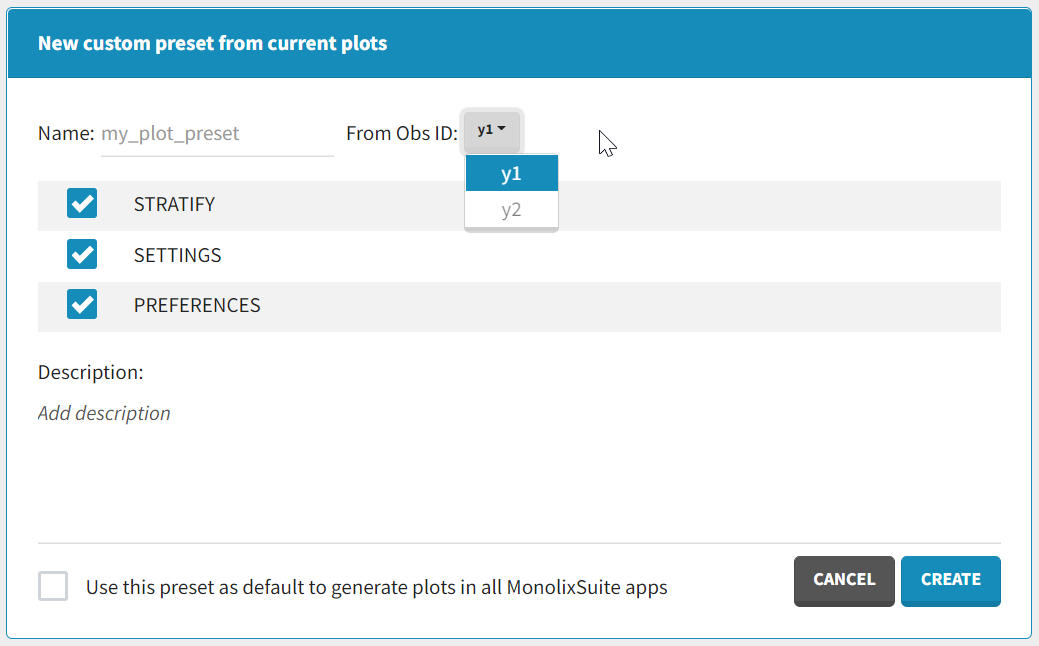
You will be asked to give a name and a description to your preset, and to select which sections of the formatting you want to include in the preset among Stratify, Settings and Preferences. If the project has several types of observations, only the plots corresponding to one of them can be used to define the preset so it is necessary to select the observation id. You can also choose to set this preset as your default, which means that when creating a new project or when you click on Reset, the plot formatting from this preset will be applied instead of the system default.
Applying a plot preset
After saving your preset, it will be available in the list of presets that you can choose from when you click on “From preset” in the window that opens with “Apply…” in the Plot Formatting panel.
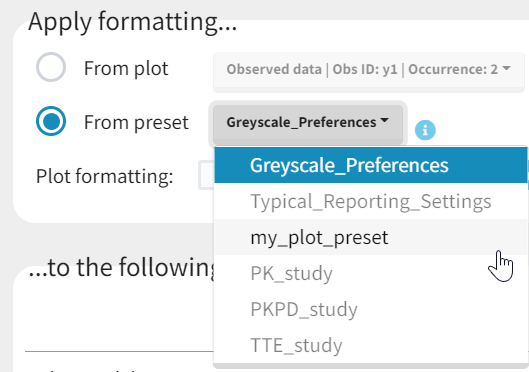
You can apply your preset to a list of plots in another project, by opening this project, clicking on “Apply…” and “From preset” and by selecting the preset and the target plots, and finally clicking on Apply. This will transfer the plot configurations from the preset to the target plots.
The target plots must be:
- the same type of plots that were used to define the preset: for example if no VPC had been generated in the project used to define the preset, then the plot preset cannot be applied to a VPC in a new project, as there is no VPC formatting option to apply. The VPC will be greyed out in the list of target plots.
- the same plot occurrence that was used to define the preset: for example if the project used to define the preset had only one VPC occurrence, and you want to apply that preset in a project where you have generated two VPC occurrences, then the second VPC occurrence will be greyed out in the list of target plots.
Note that axis limits values and bins settings are not saved as part of the preset because they are considered too project-specific.
Please note this major difference between “Apply formatting from plot” and “Apply formatting from preset”:
- “Apply formatting from plot” applies all selected options from the source plot to all selected target plots. Thus, if you select a VPC stratified by STUDY as source plot and the Observed data plot as target plot, and “Stratify” section in plot formatting to be transfer, you will obtain the Observed data plot stratified by STUDY.
- “Apply formatting from preset” applies the selected options from each plot saved in the preset to the corresponding plot in your project. Thus, if you saved a preset including the “Stratify” section based on a project where the VPC is stratified by STUDY but not the Observed data plot, applying that preset to another project will stratify the VPC by STUDY but not the Observed data plot.
Managing plot presets
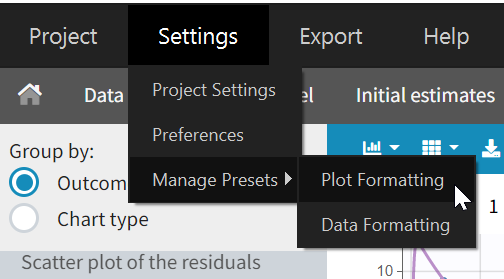
You can also manage your presets by going to Settings > Manage presets > Plot formatting.
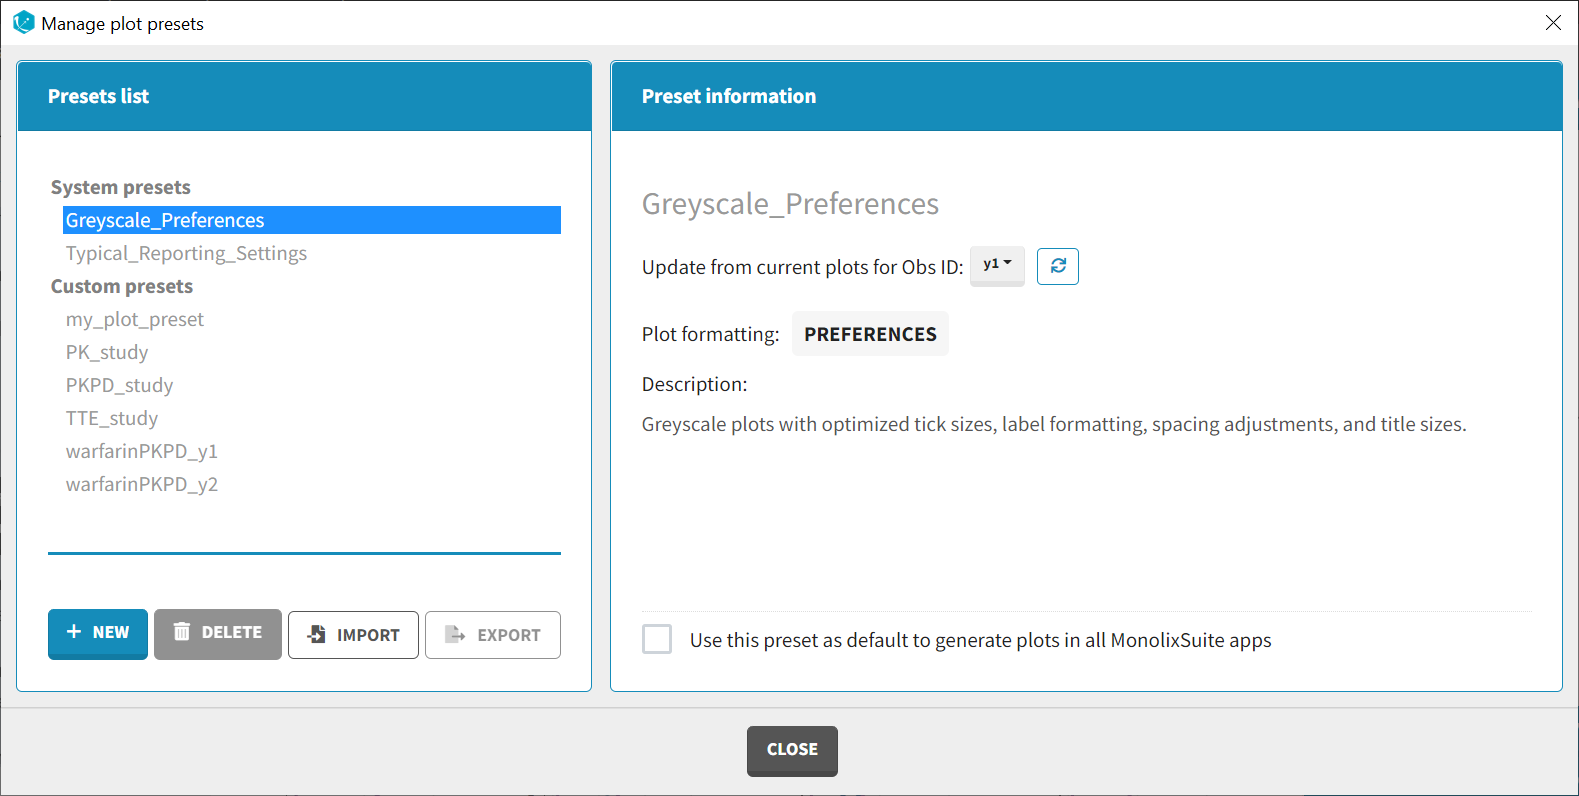
This will open a window where you can see all presets, modify, update or remove your custom presets, and export or import them as separate files with a lixpst extension. That way you can easily share your presets with your colleagues or collaborators to standardize your plot formatting.
Applying pre-defined plot formatting
In addition to your custom presets, MonolixSuite also provides two pre-defined presets that you can use to apply plot formatting. These presets are:
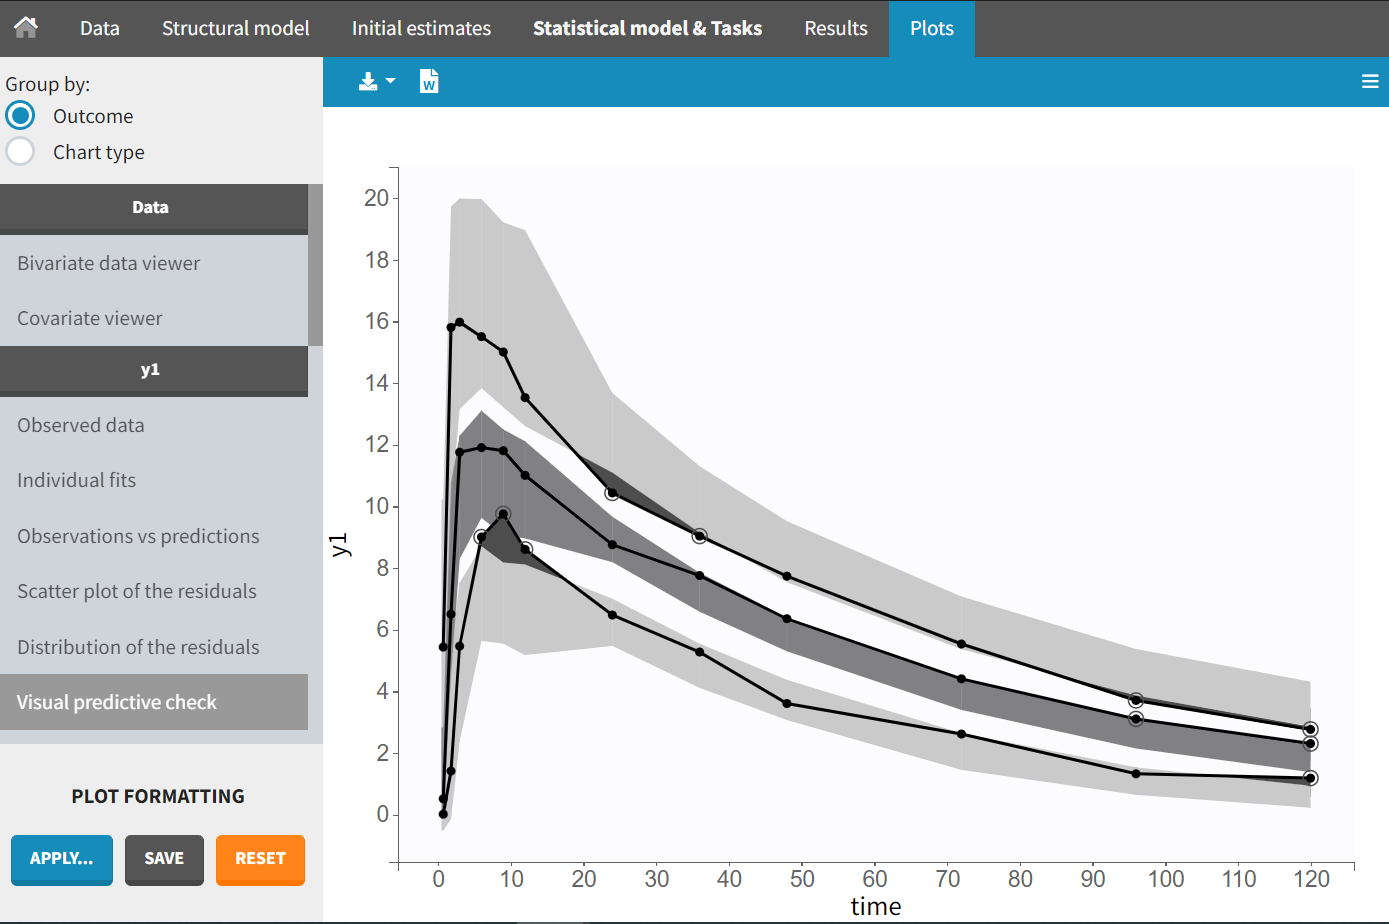
- Greyscale_Preferences: This preset affects only the Preferences section of the plot configurations, and produces publication-ready greyscale plots with optimized size and spacing of the texts to improve readability of the plots (example shown below for the VPC).
- Typical_Reporting_Settings: This preset affects only the Settings section of the plot configuration, and corresponds to plot settings typically chosen to report the analysis results. In addition to removing the grid in the background for all plots:
- VPC: observed data points and predicted percentiles are displayed (see example below)
- Observation vs Predictions: Observations vs Population Predictions are displayed in addition to Observations vs Individual Predictions
- Scatterplot of the residuals: Population residuals and NPDE are displayed in addition to Individual residuals.


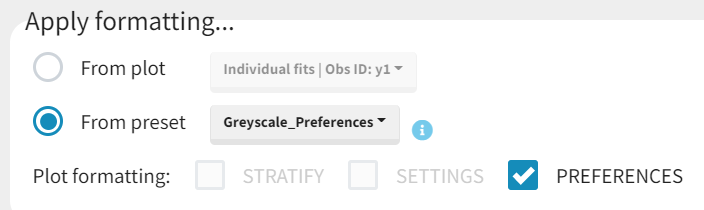
You can apply these presets to any plot in your project by selecting them from the list of presets and clicking on Apply. You can also combine these presets with your own presets or with the Apply from plot feature, to create the plot configuration that suits your needs.
Restoring default plot configuration
Using the Reset button
If you want to restore the default plot configuration, you can click on the Reset icon in the Apply from plot panel. This will reset all plots to the system default, or to your custom default if you have defined one.

Note that resetting the plot configuration will not affect the plot presets that you have defined or imported. You can still apply them to any plot after resetting.
Defining a custom default
To define a custom default, you need to create a preset and select the option “Use this preset as default” when saving it. This will make this preset the default configuration for all plots. You can also unset a preset as default by going to Settings > Manage presets > Plot formatting, and unchecking the option “Use this preset as default” for the preset.