Monolix includes a convergence assessment tool. It allows to execute a workflow of estimation tasks several times, with different, randomly generated, initial values of fixed effects, as well as different seeds. The goal is to assess the robustness of the convergence.
Running the convergence assessment
For that, click on the shortcut button in the “Tasks” part.
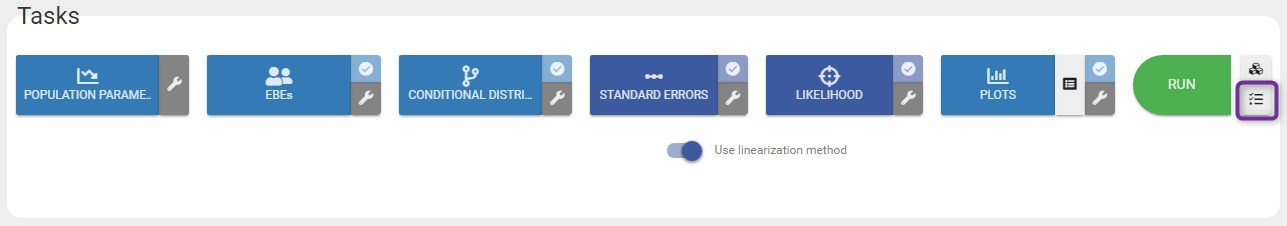
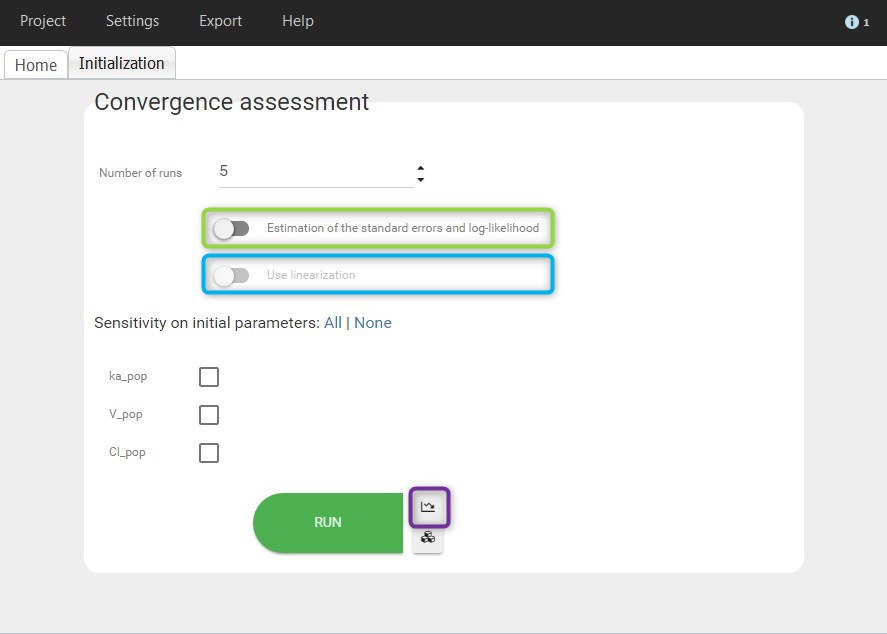
A dedicated panel opens as in the figure below. The first shortcut button next to Run can be used to go back to the estimation.
The user can define
-
- the number of runs, or replicates
- the type of assessment:
- Estimation of the standard errors and log-likelihood
- Use the linearization method if the previous option is selected.
- the initial parameters. By default, initial values are uniformly drawn from intervals defined around the estimated values if population parameters have been estimated, the initial estimates otherwise. Notice that it is possible to set one initial parameter constant while generating the others. The minimum and maximum of the generated parameters can be modified by the user.
All settings used are saved and reloaded with the run containing the convergence assessment results.
Notice that
- In the case of estimation of the standard errors and log-likelihood by linearization, the individual parameters with the conditional mode method are computed as well to have more relevant linearization.
- In the case of estimation of the standard errors and log-likelihood without the linearization, the conditional distribution method is computed too to have more relevant estimation.
- The workflow is the same between the runs and is not the one defined in the interface.
Click on Run to execute the tool. Thus you are able to estimate the population parameters using several initial seeds and/or several initial conditions.
Display and outputs
Several kinds of plots are given as a summary of the results.
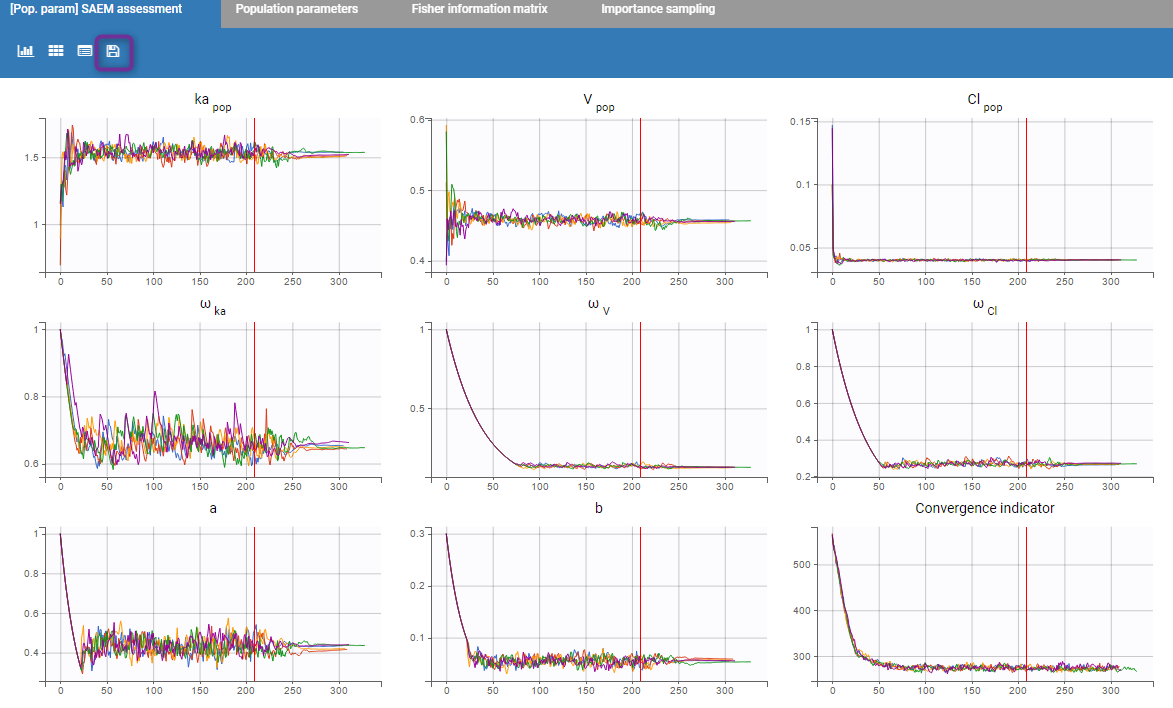
First of all, the SAEM convergence assessment is proposed. The convergence of each parameter on each run is proposed. It allows to see if the convergence for each run is ok.
Then, a plot showing the estimated values for each replicate is proposed. If the estimation of the standard errors was included in the scenario, the estimated standard errors are also displayed as horizontal bars. It allows to see if all parameters converge statistically to the same values.
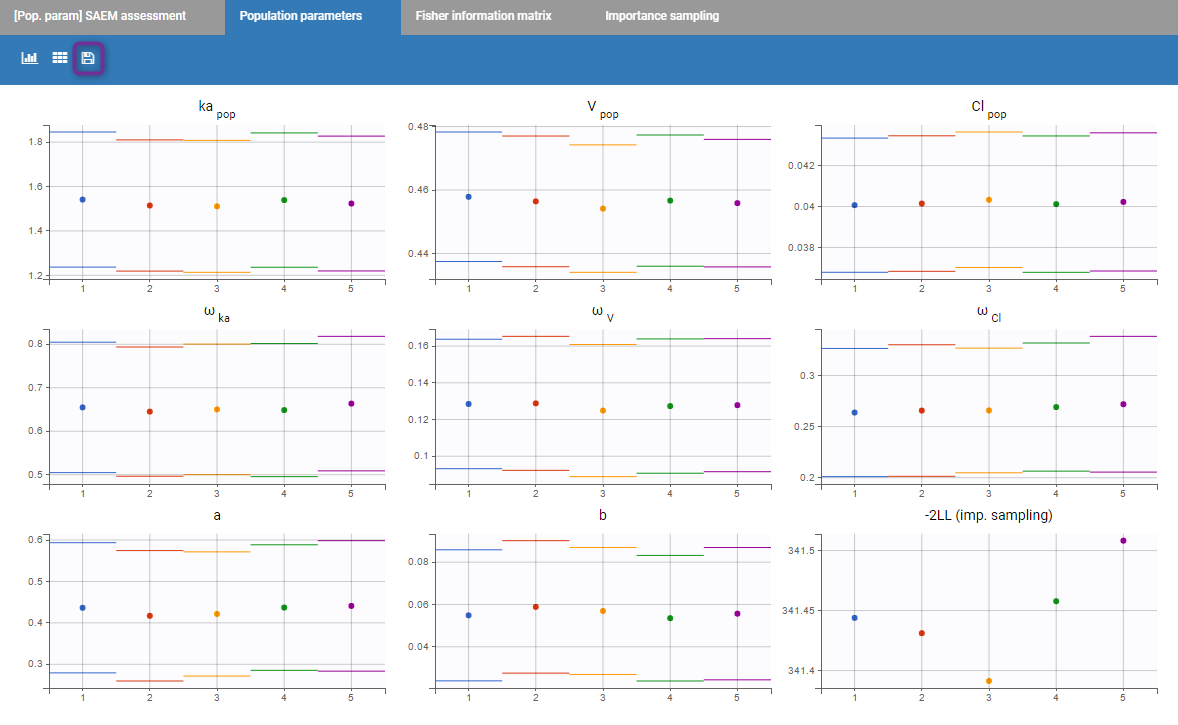
Starting from the 2019 version, it is possible to export manually all the plots in the Assessment folder in your result folder by clicking on the “export” icon (purple box on the previous figure).
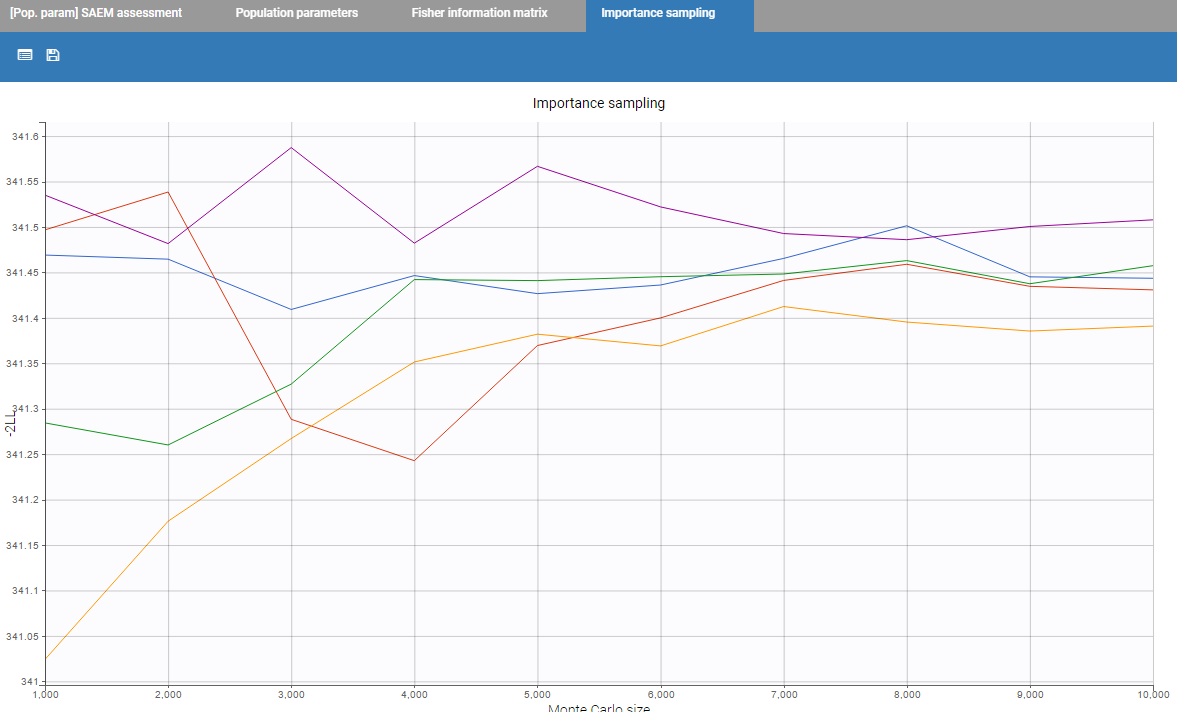
Finally, if log-likelihood without linearization is used, the curves for convergence of importance sampling are proposed.
In addition, a Monolix project and its result folder is generated for each set of initial parameters. They are located in the Assessment subfolder of the main project’s result folder (located by default next to the .mlxtran project file). Along with all the runs, there is a summary of all the runs “assessment.txt” providing all the individual parameter estimates along with the -2LL, as in the following:
Parameters,Run_1,Run_2,Run_3,Run_4,Run_5
Cl_pop,0.03994527,0.04017999,0.04016216,0.04012077,0.0400175
V_pop,0.4575748,0.4556463,0.4560732,0.4557009,0.4569431
a,0.4239969,0.42482,0.4227559,0.4294611,0.435585
b,0.05653124,0.05684357,0.05700663,0.054965,0.05450724
ka_pop,1.527947,1.521184,1.5226,1.519333,1.519678
omega_Cl,0.2653109,0.2643172,0.268475,0.266199,0.2693083
omega_V,0.1293328,0.1274441,0.122951,0.1301242,0.1261098
omega_ka,0.6530206,0.6655251,0.643456,0.6425528,0.6424614
-2LL,339.387,339.417,339.429,339.444,339.462
Notice that, starting from the 2019 version, it is possible to reload all the results of a previous convergence if nothing has changed in the project. Starting from version 2021, the settings of the convergence assessment are also reloaded.
Best practices: what is the use the convergence assessment tool?
We cannot claim that SAEM always converges (i.e., with probability 1) to the global maximum of the likelihood. We can only say that it converges under quite general hypotheses to a maximum – global or perhaps local – of the likelihood. A large number of simulation studies have shown that SAEM converges with high probability to a “good” solution – hopefully the global maximum – after a small number of iterations. The purpose of this tool is to evaluate the SAEM algorithm with initial conditions and see if the estimated parameters are the “global” minimum.
The trajectory of the outputs of SAEM depends on the sequence of random numbers used by the algorithm. This sequence is entirely determined by the “seed.” In this way, two runs of SAEM using the same seed will produce exactly the same results. If different seeds are used, the trajectories will be different but convergence occurs to the same solution under quite general hypotheses. However, if the trajectories converge to different solutions, that does not mean that any of these results are “false”. It just means that the model is sensitive to the seed or to the initial conditions. The purpose of this tool is to evaluate the SAEM algorithm with several seeds to see the robustness of the convergence.