It is possible to show the matrix of all the covariates as on the following figure:
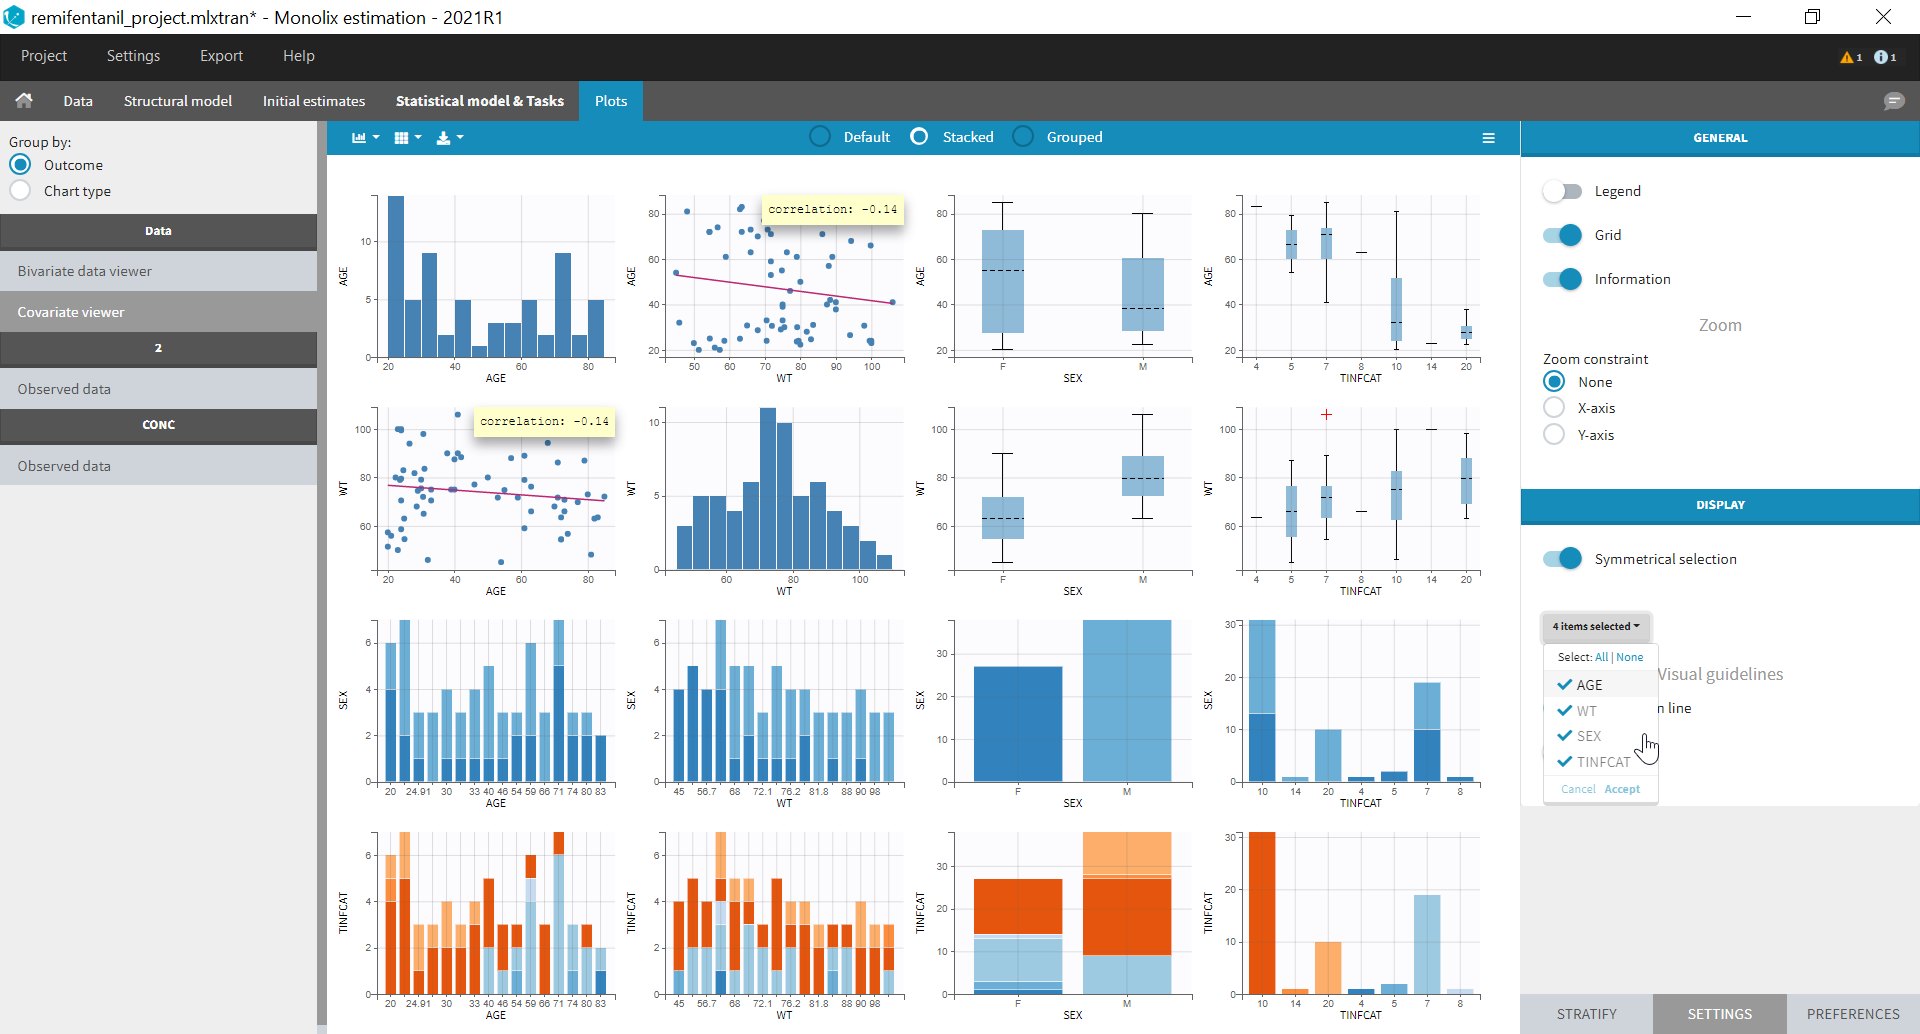
It is possible to display one covariate vs another one, selecting in the display panel which covariate to look at.
Here we display the age versus the wt and show the correlation coefficient as an information:

Categorical covariates w.r.t. other categorical covariates are displayed as a histogram (stacked or grouped),

and continuous covariates w.r.t. categorical covariates are displayed as a boxplot as below (“+” are outlier points below Q1-1.5*IQR (interquartile range) or above Q3+1.5*IQR):

Covariate statistics
Starting from the 2021 version, it is also possible to get the covariate statistics in a dedicated frame of the interface:
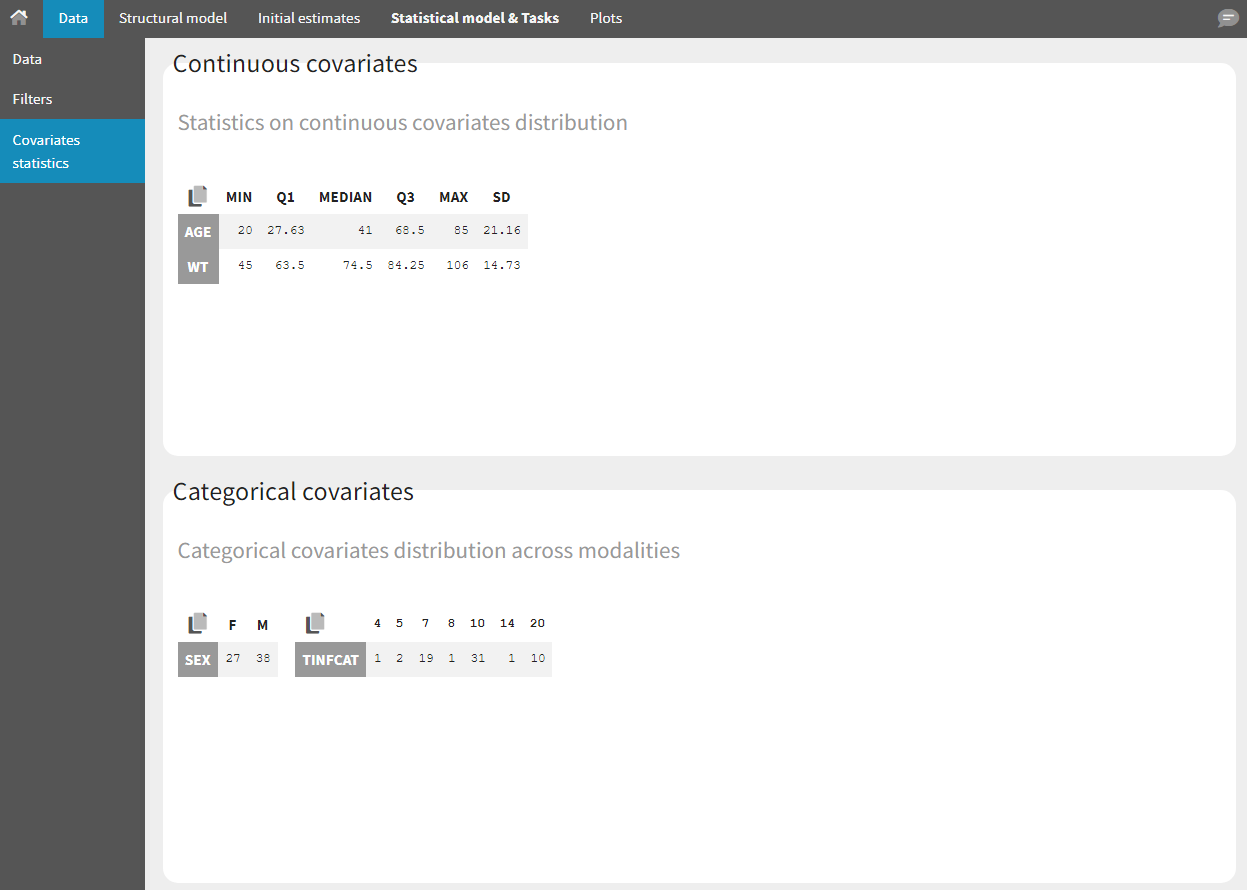
All the covariates (if any) are displayed and a summary of the statistics is proposed. For continuous covariates, minimum, median and maximum values are proposed along with the first and third quartile, and the standard deviation. For categorical covariates, all the modalities are displayed along with the number of each. Note the “Copy table” button that allows to copy the table in Word and Excel. The format and the display of the table will be preserved.