Purpose
This plot displays the proportion of censored data w.r.t. time. It is possible to choose the censoring interval. This plot is only available for projects with censored data.
Examples
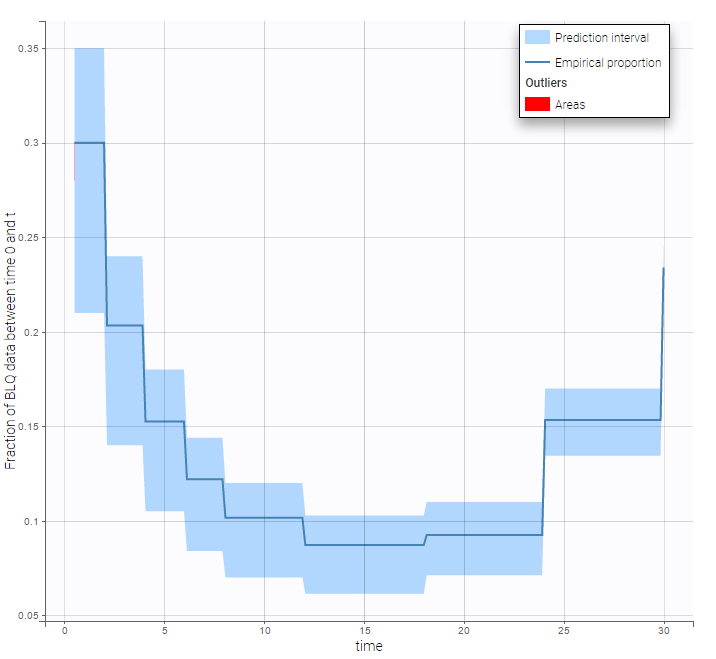
The figure presents the simulated and empirical BLQ frequencies w.r.t.time (example taken from the censored1_project of the demos).
Censored interval
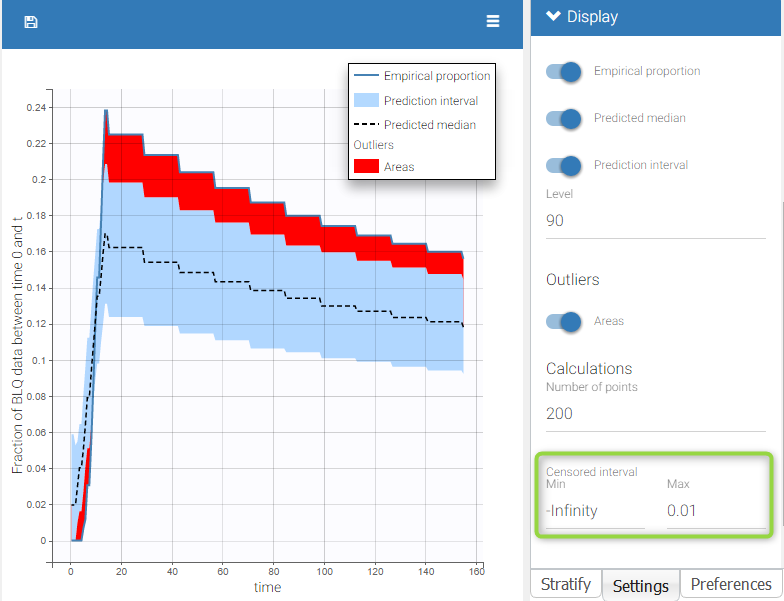
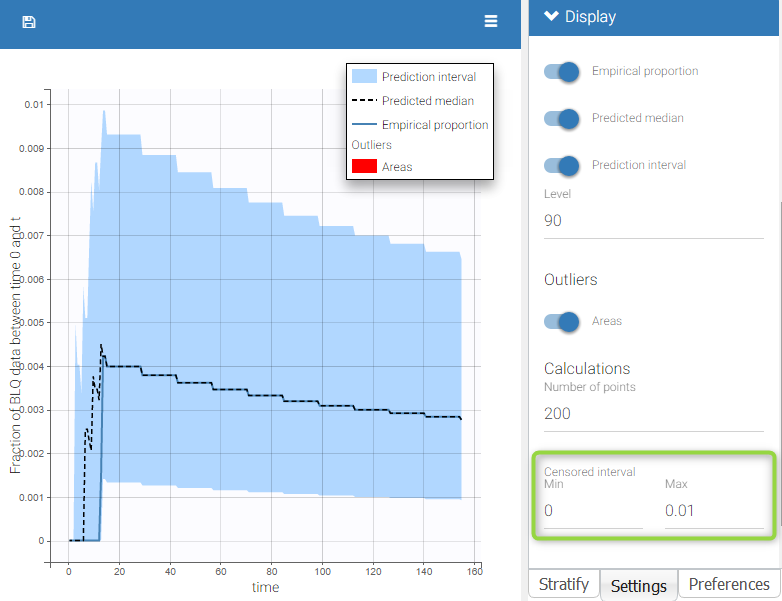
The censored interval can be modified in Display. By default, the limit and the censored values are used. However, one can look at a smaller censored interval for example. This is the case with the example below: on the left, the BLQ predictive check uses the default censored interval wher Min=-Infinity because there is no LIMIT column in the dataset. Since the observations are PK concentrations, Min=0 has been specified on the right, and no more outlier area is visible. This suggests that the outlier areas seen on the left are due to predicted negative values for censored observations, which means that it would be important in this case to specify a null lower limit for the censored observations by adding a column LIMIT to the dataset.
 |
 |
Settings
- General: Add/remove legend or grid
- Display
- Empirical proportion: Add/remove the blue line for empirical proportion of censored observations in cumulative observations.
- Predicted median : Add/remove the median proportion of censored observations in cumulative observations calculated by simulation.
- Prediction interval: Add/remove the prediction interval given by the model for the 90% quantile. The level (quantile) can be modified.
- Outliers (area): Add/remove red areas indicating time points for which the empirical proportion is outside the prediction interval.
- Calculations
- Number of point for the discretization
- Censored interval: min and max for censored data. By default, the limit and the censored values are used. However, one can look at a smaller censored interval for example.
By default, the censored area corresponds to the data set description and the BLQ frequency observation, the prediction interval, and the outliers are displayed.