Purpose
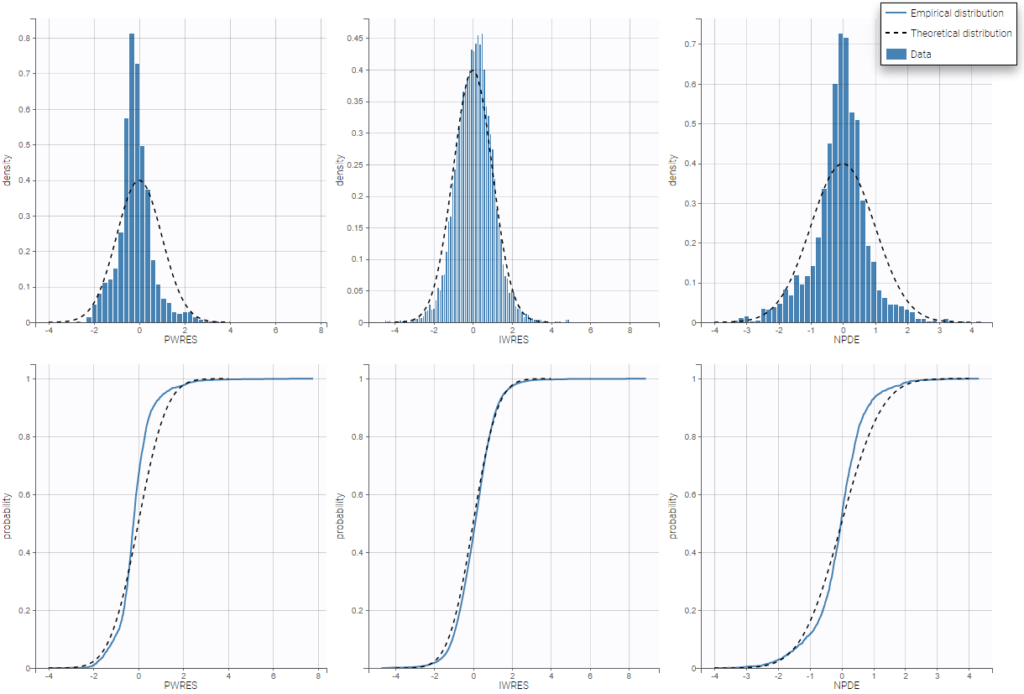
These plots display the empirical distributions of the residuals: the PWRES (population weighted residuals), the IWRES (individual weighted residuals), and the NPDEs (normalized prediction distribution errors) for continuous outputs, together with the standard Gaussian probability density function and cumulative distribution function.
If the model is true, the PWRES, IWRES and NPDEs should behave as independent standardized normal random variables. These plots are thus useful to detect misspecifications in the structural and residual error models.
Example
In the following example, the parameters of a two-compartment model with iv unfusion and linear elimination are estimated on the remifentanil data set.
Below, one can see on top the comparison between the empirical and theoretical probability density function (PDF) of the PWRES, IWRES and NPDE, and at the bottom the comparison between the empirical and theoretical cumulative distribution function (CDF).
The corresponding scatter plots can be seen on this page.
Settings
By default, all the residuals and all the plots are displayed.
- Subplots
- Residuals: choose the plots to display according to residuals
- Population residuals: PWRES
- Individual residuals: IWRES, using the individual parameter estimated using the conditional distribution, the conditional mode, or the conditional mean.
- NPDE
- X-axis
- PDF: Probability density function of residuals and empirical distribution as histograms.
- CDF: Theoretical and empirical cumulative distribution functions.
- Residuals: choose the plots to display according to residuals
- Display
- Individual estimates: choose the estimator for individual parameters as parameters drawn from the conditional distributions. or the modes or means of the conditional posterior distributions.