Purpose
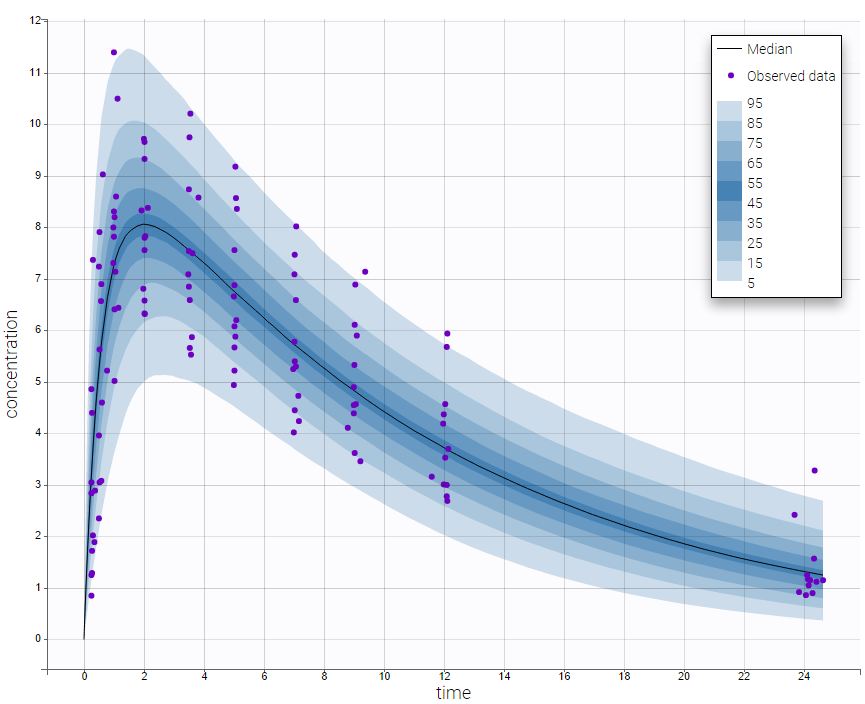
This plot displays the prediction distribution. It allows to compare the observations with the theoretical distribution of the predictions. It is based on multiple simulations of all individuals from the dataset, without the residual error. The simulations use the estimated population parameters, without considering their uncertainty.
Example
Prediction distribution plots vary slightly for different types of data. For joint models for multivariate outcomes, a separate plot is available for each type of data.
- Continuous outcomes
In the following example, the parameters of a one compartmental model with first order absorption and linear elimination are estimated on the theophylline data set. One can see the prediction distribution of the concentration overlayed with the data set.
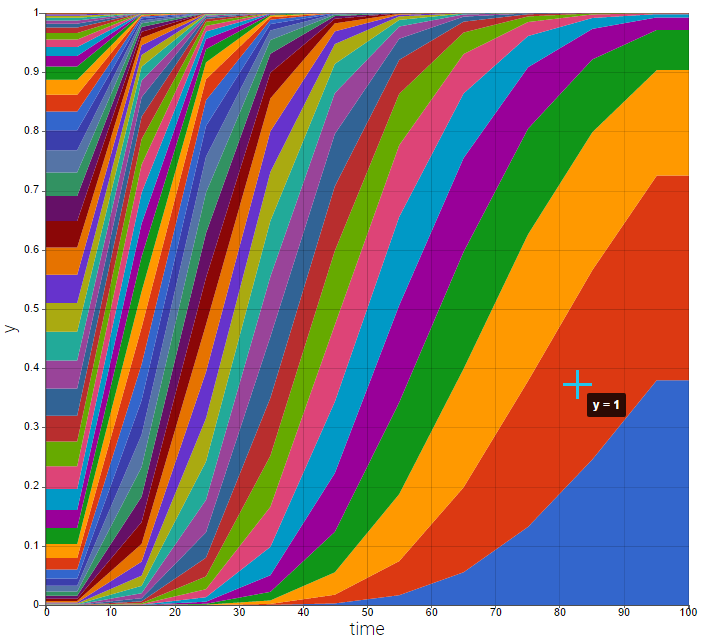
- Non-continuous outcomes: count data and categorical data
count2_project (data = ‘count2_data.txt’, model = ‘count_library/poissonTimeVarying_mlxt.txt’)
Prediction distribution plots for count data and categorical data show the predicted frequencies of the categorized data over time, computed by Monte-Carlo. In the following example, predictions come from a Poisson distribution with a time varying intensit. Note that hovering on a band reveals the corresponding modality.
Settings
- General: Add/remove legend or grid
- Display (for continuous data)
- Observed data
- BLQ: Add/remove BLQ data if present.
- Median: Add/remove the median of predictions.
- Level: set the level (90 by default). The distribution corresponds to
.
- Number of bands: set the number of bands (9 by default) and the associated percentile in case of a discrete representation
- X Bins (for discrete data)
- Bin values: Add/remove vertical lines on the plot to indicate the bins.
- Bining criteria: Choose the bining criteria among equal width (default), equal size or least-squares
- Number of bins: Choose a fixed number of bins or a range for automatic selection, and a range for the number of data points per bin.
![[50-\frac{level}{2}, 50+\frac{level}{2}]](http://s0.wp.com/latex.php?latex=%5B50-%5Cfrac%7Blevel%7D%7B2%7D%2C+50%2B%5Cfrac%7Blevel%7D%7B2%7D%5D&bg=ffffff&fg=000&s=0 "[50-\frac{level}{2}, 50+\frac{level}{2}]") .
.By default, only the prediction distribution and the median are displayed (for continuous data).